Dashboard
Network Overview
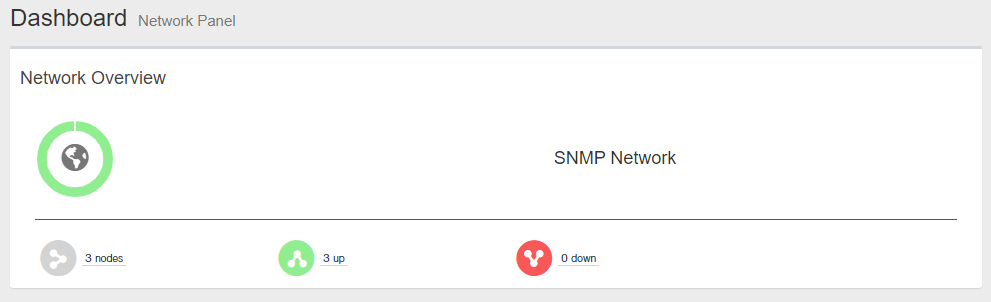
"Network Overview" summarizes the current overall status of the monitored devices.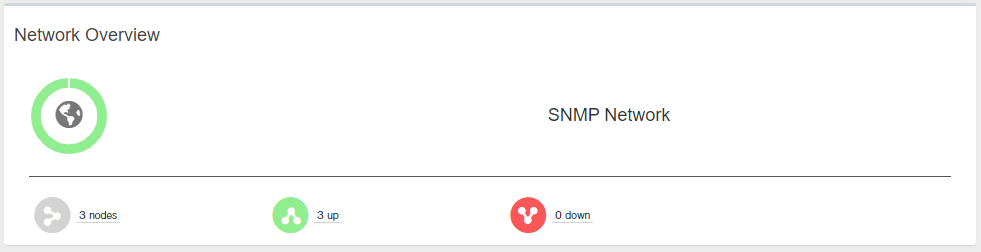
| Item Name | Description |
|---|---|
Doughnut Chart
|
Shows percentages of the monitored devices in UP (green) and DOWN (red) states. |
| Shows the number of monitored devices. | |
| Shows the number of monitored devices in UP state (Reachable from the SNMP Plug-in). | |
| Shows the number of monitored devices in DOWN state (Unreachable from the SNMP Plug-in). |
09 Aug 2024 14:10